
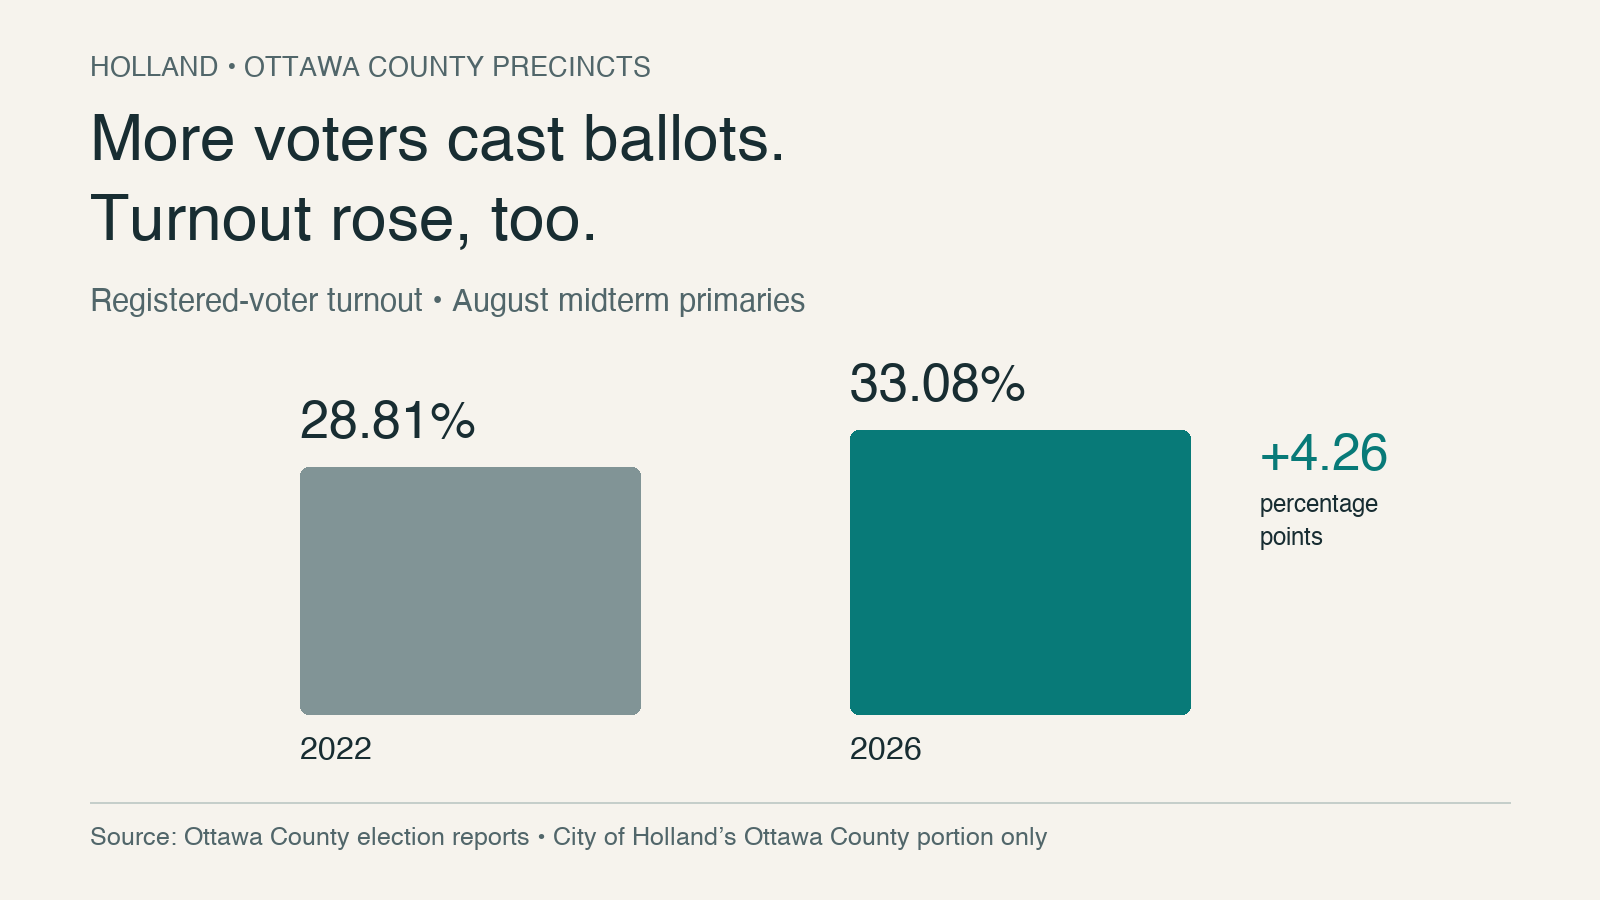
More people cast ballots in Holland’s Ottawa County precincts in this year’s August primary than in the previous midterm primary. Both the number of ballots and the share of registered voters participating increased, according to calculations from official county reports.
That finding gives a factual basis to a limited version of the growing-participation argument in Rebecca Padnos Altamirano’s accompanying essay. It does not establish what happened throughout the whole city, how Latino residents voted or what caused the increase.
A comparison of matching elections
The relevant comparison is the August 2, 2022 primary against the August 4, 2026 primary. Both were midterm-year state primaries. Comparing either with a presidential general election or a municipal election would mix contests with different offices, electorates and incentives to participate.
The calculation adds the total ballots and registered voters reported for each City of Holland precinct in the Ottawa County election archive, counting each precinct once. It includes all voting methods recorded in each report and excludes the separate municipality of Holland Charter Township.
| City of Holland, Ottawa County portion | 2022 primary | 2026 primary | Change |
|---|---|---|---|
| Ballots cast | 6,005 | 6,803 | +798; +13.29% |
| Registered voters | 20,840 | 20,566 | −274 |
| Registered-voter turnout | 28.81% | 33.08% | +4.26 percentage points |
The rise in participation is visible in the ballot count itself; it is not simply a consequence of the smaller registration denominator. The percentage change in ballots and the percentage-point change in turnout describe different measures and should not be used interchangeably.
Turnout rates were calculated by dividing the combined ballots by the combined registration totals. Averaging the individual precinct percentages would give small precincts the same weight as large ones and could produce a misleading result.
Holland’s county line limits the finding
The City of Holland spans Ottawa and Allegan counties. A whole-city turnout comparison must include both sets of precincts. Ottawa County totals alone cannot establish a citywide rate or percentage increase.
Allegan County’s August 2026 archive lists official election documents and a statement of votes cast. The linked PDFs returned access-denied responses during this review. An accessible Allegan results page reports candidate vote totals, but votes in a particular race are not a substitute for ballots cast: voters may skip a contest or cast an invalid vote while still participating in the election.
The remaining step for a full-city claim is to obtain Allegan’s Holland ballot and registration totals for both primaries and add them to the Ottawa totals. Until then, the geographic qualifier belongs in any published claim.
Precincts were also reconfigured between elections. This analysis aggregates the county portion of the city rather than comparing identically numbered precincts. A formal check for any material city-boundary changes has not been completed.
Local turnout and Latino turnout are different findings
The county tables do not identify voters’ ethnicity. They therefore cannot establish whether Latino turnout increased in Holland, even if participation increased in precincts with Latino residents. That question requires separate demographic research and a clear explanation of how ethnicity is estimated.
There is a separate statewide finding. MI Poder’s post-primary research estimated a 13 to 18 percent increase in Latino turnout between the 2022 and 2026 August primaries, Michigan Advance reported. The article attributes the estimate to the organization; its underlying research and detailed methodology were not available for this review. It reports a percent increase, not a percentage-point increase in a turnout rate.
The statewide estimate and the local calculation cover different populations. Their similar-sized increases do not make them interchangeable or establish that Holland followed the statewide Latino pattern.
The statewide opportunity behind the argument
Other data support the broader argument that participation matters in a closely divided state. WKAR reported in 2024 that Michigan had more than 300,000 eligible Latino voters. That is a dated eligibility estimate, not a count of registered voters or ballots.
A USC Center for Inclusive Democracy analysis estimated that 177,068 eligible Latino Michiganders did not vote in the 2020 general election. That exceeded Joe Biden’s statewide winning margin of 154,188 votes, which can be calculated from Michigan’s official totals. The comparison illustrates the scale of potential participation; it does not assume those nonvoters would support the same candidate.
Michigan’s 2025 population table estimates 645,237 Hispanic residents statewide. That population includes children and noncitizens and must remain distinct from the eligible electorate.
What the records cannot say about the gathering
The interview with Jorge and Paola Ramos took place on October 25, after the August primary. It therefore could not have caused the primary increase. Attendance and registration for the event demonstrate interest in that gathering; they do not establish that attendees registered to vote, cast a ballot or changed their minds.
Nor can final turnout for the November 2026 general election be compared yet: Election Day is November 3. Any assessment using early ballots must compare equivalent points before Election Day and account for changes in available voting methods.
The defensible local conclusion is that participation increased in the Ottawa County portion of Holland between matching midterm primaries. Whether that increase extended across the city, how Latino participation changed and what brought additional voters out remain reporting questions.
Read Rebecca Padnos Altamirano’s accompanying essay: Latinos Showed Up in Holland. Where Was the National Press?